
A SHAREHOLDER BASE THAT STANDS OUT FOR ITS STABILITY AND LOYALTY
Shareholding structure as at 31 December 2025 (in % of voting rights)
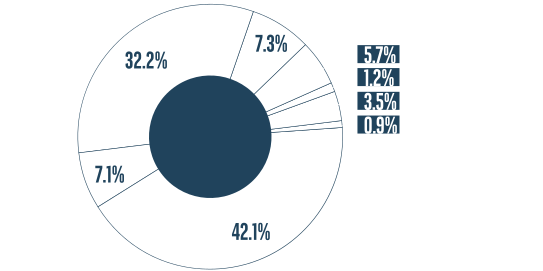
This diagram presents the shareholding structure of BNP Paribas.
- European institutional investors(1, Based on analyses from the SRD2 surveys - Institutional investors excluding BlackRock (in 2023, 2024 and 2025) and Amundi (in 2023 and 2024).): 42.1%
- Non-European institutional investors(1, Based on analyses from the SRD2 surveys - Institutional investors excluding BlackRock (in 2023, 2024 and 2025) and Amundi (in 2023 and 2024).): 32.2%
- BlackRock Inc.: 7.1%
- Individual shareholders(1, Based on analyses from the SRD2 surveys - Institutional investors excluding BlackRock (in 2023, 2024 and 2025) and Amundi (in 2023 and 2024).): 7.3%
- SFPI(2, “Société Fédérale de Participations et d’Investissement”: a public-interest limited company (société anonyme) acting on behalf of the Belgian State.): 5.7%
- Grand Duchy of Luxembourg: 1.2%
- Group FCPE(3, The voting rights of the FCPE (profit-sharing scheme) are exercised, after the decision is taken by the Supervisory Board, by its Chairman.): 3.5%
- Directly held by employees: 0.9%
SHAREHOLDER DASHBOARD
| IN EUROS | 2021 | 2022 | 2023 | 2024 | 2025 |
|---|---|---|---|---|---|
| Net income attributable to the shareholders per share(1, Based on the average number of shares outstanding during the year. Calculated in 2023 on the basis of the distributable 2023 earnings and the number of shares outstanding at year-end.) | Net income attributable to the shareholders per share (1, Based on the average number of shares outstanding during the year. Calculated in 2023 on the basis of the distributable 2023 earnings and the number of shares outstanding at year-end.)2021 Net income attributable to the shareholders per share (1, Based on the average number of shares outstanding during the year. Calculated in 2023 on the basis of the distributable 2023 earnings and the number of shares outstanding at year-end.)2021 7.26 |
Net income attributable to the shareholders per share (1, Based on the average number of shares outstanding during the year. Calculated in 2023 on the basis of the distributable 2023 earnings and the number of shares outstanding at year-end.)2022 Net income attributable to the shareholders per share (1, Based on the average number of shares outstanding during the year. Calculated in 2023 on the basis of the distributable 2023 earnings and the number of shares outstanding at year-end.)2022 7.80 |
Net income attributable to the shareholders per share (1, Based on the average number of shares outstanding during the year. Calculated in 2023 on the basis of the distributable 2023 earnings and the number of shares outstanding at year-end.)2023 Net income attributable to the shareholders per share (1, Based on the average number of shares outstanding during the year. Calculated in 2023 on the basis of the distributable 2023 earnings and the number of shares outstanding at year-end.)2023 9.21 |
Net income attributable to the shareholders per share (1, Based on the average number of shares outstanding during the year. Calculated in 2023 on the basis of the distributable 2023 earnings and the number of shares outstanding at year-end.)2024 Net income attributable to the shareholders per share (1, Based on the average number of shares outstanding during the year. Calculated in 2023 on the basis of the distributable 2023 earnings and the number of shares outstanding at year-end.)2024 9.57 |
Net income attributable to the shareholders per share (1, Based on the average number of shares outstanding during the year. Calculated in 2023 on the basis of the distributable 2023 earnings and the number of shares outstanding at year-end.)2025 Net income attributable to the shareholders per share (1, Based on the average number of shares outstanding during the year. Calculated in 2023 on the basis of the distributable 2023 earnings and the number of shares outstanding at year-end.)2025 10.29 |
| Net book value per share(2, Before distribution. Revalued net book value based on the number of shares for 2023, with earnings per share calculated on the number of shares outstanding at period-end.) | Net book value per share (2, Before distribution. Revalued net book value based on the number of shares for 2023, with earnings per share calculated on the number of shares outstanding at period-end.)2021 Net book value per share (2, Before distribution. Revalued net book value based on the number of shares for 2023, with earnings per share calculated on the number of shares outstanding at period-end.)2021 88.0 |
Net book value per share (2, Before distribution. Revalued net book value based on the number of shares for 2023, with earnings per share calculated on the number of shares outstanding at period-end.)2022 Net book value per share (2, Before distribution. Revalued net book value based on the number of shares for 2023, with earnings per share calculated on the number of shares outstanding at period-end.)2022 89.0 |
Net book value per share (2, Before distribution. Revalued net book value based on the number of shares for 2023, with earnings per share calculated on the number of shares outstanding at period-end.)2023 Net book value per share (2, Before distribution. Revalued net book value based on the number of shares for 2023, with earnings per share calculated on the number of shares outstanding at period-end.)2023 96.0 |
Net book value per share (2, Before distribution. Revalued net book value based on the number of shares for 2023, with earnings per share calculated on the number of shares outstanding at period-end.)2024 Net book value per share (2, Before distribution. Revalued net book value based on the number of shares for 2023, with earnings per share calculated on the number of shares outstanding at period-end.)2024 102.5 |
Net book value per share (2, Before distribution. Revalued net book value based on the number of shares for 2023, with earnings per share calculated on the number of shares outstanding at period-end.)2025 Net book value per share (2, Before distribution. Revalued net book value based on the number of shares for 2023, with earnings per share calculated on the number of shares outstanding at period-end.)2025 104.3 |
| Net dividend per share | Net dividend per share 2021 Net dividend per share 2021 3.67 (3, Taking into account only the distribution of the 2021 dividend and not taking into account the €900 million share buyback programme, executed between 1 November 2021 and 6 December 2021.) |
Net dividend per share 2022 Net dividend per share 2022 3.90 (4, Taking into account only the distribution of Taking into account only the distribution of the 2024 dividend and not taking into account the €1.08 billion share buyback programme in respect of the so-called “ordinary” distribution. the 2022 dividend and not taking into account the €962 million share buyback programme in respect of the so-called “ordinary” distribution.) |
Net dividend per share 2023 Net dividend per share 2023 4.60 (5, Taking into account only the distribution of the 2023 dividend and not taking into account the €1.05 billion share buyback programme in respect of the so-called “ordinary” distribution.) |
Net dividend per share 2024 Net dividend per share 2024 4.79 (6, aking into account only the distribution of the 2024 dividend and not taking into account the €1.08 billion share buyback programme in respect of the so-called “ordinary” distribution.) |
Net dividend per share 2025 Net dividend per share 2025 5.16 (7, Subject to approval by the Annual General Meeting of 12 May 2026. Considering the €2.59 interim dividend per share paid on 30 September 2025, the final dividend related to the 2025 financial year would amount to €2.57 per eligible share. Not taking into account the €1.15 billion share buyback programme carried out in 2025 in respect of the 2025 financial year.) |
| Cash payout ratio (%)(8, Cash dividend distribution recommended at the Annual General Meeting expressed as a percentage of distributable net income attributable to shareholders.) | Cash payout ratio (%) (8, Cash dividend distribution recommended at the Annual General Meeting expressed as a percentage of distributable net income attributable to shareholders.)2021 Cash payout ratio (%) (8, Cash dividend distribution recommended at the Annual General Meeting expressed as a percentage of distributable net income attributable to shareholders.)2021 50.00 (3, Taking into account only the distribution of the 2021 dividend and not taking into account the €900 million share buyback programme, executed between 1 November 2021 and 6 December 2021.) |
Cash payout ratio (%) (8, Cash dividend distribution recommended at the Annual General Meeting expressed as a percentage of distributable net income attributable to shareholders.)2022 Cash payout ratio (%) (8, Cash dividend distribution recommended at the Annual General Meeting expressed as a percentage of distributable net income attributable to shareholders.)2022 50.00 (4, Taking into account only the distribution of Taking into account only the distribution of the 2024 dividend and not taking into account the €1.08 billion share buyback programme in respect of the so-called “ordinary” distribution. the 2022 dividend and not taking into account the €962 million share buyback programme in respect of the so-called “ordinary” distribution.) |
Cash payout ratio (%) (8, Cash dividend distribution recommended at the Annual General Meeting expressed as a percentage of distributable net income attributable to shareholders.)2023 Cash payout ratio (%) (8, Cash dividend distribution recommended at the Annual General Meeting expressed as a percentage of distributable net income attributable to shareholders.)2023 50.00 (5, Taking into account only the distribution of the 2023 dividend and not taking into account the €1.05 billion share buyback programme in respect of the so-called “ordinary” distribution.) |
Cash payout ratio (%) (8, Cash dividend distribution recommended at the Annual General Meeting expressed as a percentage of distributable net income attributable to shareholders.)2024 Cash payout ratio (%) (8, Cash dividend distribution recommended at the Annual General Meeting expressed as a percentage of distributable net income attributable to shareholders.)2024 50.00 (6, Taking into account only the distribution of the 2024 dividend and not taking into account the €1.08 billion share buyback programme in respect of the so-called “ordinary” distribution.) |
Cash payout ratio (%) (8, Cash dividend distribution recommended at the Annual General Meeting expressed as a percentage of distributable net income attributable to shareholders.)2025 Cash payout ratio (%) (8, Cash dividend distribution recommended at the Annual General Meeting expressed as a percentage of distributable net income attributable to shareholders.)2025 50.00 (7, Subject to approval by the Annual General Meeting of 12 May 2026. Considering the €2.59 interim dividend per share paid on 30 September 2025, the final dividend related to the 2025 financial year would amount to €2.57 per eligible share. Not taking into account the €1.15 billion share buyback programme carried out in 2025 in respect of the 2025 financial year.) |
| COURS | 2021 | 2022 | 2023 | 2024 | 2025 |
| Highest(9, Recorded intra-day during trading session.) | Highest (9, Recorded intra-day during trading session.)2021 Highest (9, Recorded intra-day during trading session.)2021 62.55 |
Highest (9, Recorded intra-day during trading session.)2022 Highest (9, Recorded intra-day during trading session.)2022 68.07 |
Highest (9, Recorded intra-day during trading session.)2023 Highest (9, Recorded intra-day during trading session.)2023 67.02 |
Highest (9, Recorded intra-day during trading session.)2024 Highest (9, Recorded intra-day during trading session.)2024 73.08 |
Highest (9, Recorded intra-day during trading session.)2025 Highest (9, Recorded intra-day during trading session.)2025 84.70 |
| Lowest(9, Recorded intra-day during trading session.) | Lowest (9, Recorded intra-day during trading session.)2021 Lowest (9, Recorded intra-day during trading session.)2021 39.71 |
Lowest (9, Recorded intra-day during trading session.)2022 Lowest (9, Recorded intra-day during trading session.)2022 40.67 |
Lowest (9, Recorded intra-day during trading session.)2023 Lowest (9, Recorded intra-day during trading session.)2023 47.02 |
Lowest (9, Recorded intra-day during trading session.)2024 Lowest (9, Recorded intra-day during trading session.)2024 53.08 |
Lowest (9, Recorded intra-day during trading session.)2025 Lowest (9, Recorded intra-day during trading session.)2025 57.92 |
| Year-end | Year-end 2021 Year-end 2021 60.77 |
Year-end 2022 Year-end 2022 53.25 |
Year-end 2023 Year-end 2023 62.59 |
Year-end 2024 Year-end 2024 59.22 |
Year-end 2025 Year-end 2025 80.79 |
| CAC 40 index on 31 December | CAC 40 index on 31 December 2021 CAC 40 index on 31 December 2021 7,153.03 |
CAC 40 index on 31 December 2022 CAC 40 index on 31 December 2022 6,473.76 |
CAC 40 index on 31 December 2023 CAC 40 index on 31 December 2023 7,543.18 |
CAC 40 index on 31 December 2024 CAC 40 index on 31 December 2024 7,380.74 |
CAC 40 index on 31 December 2025 CAC 40 index on 31 December 2025 8,149.50 |
KEEPING OUR SHAREHOLDERS AND INVESTORS INFORMED
BNP Paribas provides all its shareholders with clear, consistent and high-quality information on a regular basis, in accordance with the recommendations of the market authorities and best market practices. Our Investor Relations team keeps institutional investors and financial analysts informed of the Company’s strategy, significant developments and financial results, published each quarter.
COMMUNICATING WITH OUR INDIVIDUAL SHAREHOLDERS: THE SHAREHOLDER LIAISON COMMITTEE
This Committee is made up of ten shareholders, chosen for their geographical and socio-economic diversity, as well as two current or former employees. They are appointed for a term of three years. The Committee meets several times a year.
LEADING THE SHAREHOLDER COMMUNITY: THE “CERCLE DES ACTIONNAIRES”
The “Cercle des actionnaires” (Shareholders’ Club) brings together some 46,500 shareholders owning at least 200 BNP Paribas shares. Its members benefit from a wide range of events throughout France, in line with the Group’s commitments. Nearly 300 events were organised for them in 2025. In line with the Group’s CSR strategy, the Club’s team organised workshops with the GoodPlanet Foundation, which proved highly successful.